Introduction: The Mission-Critical Imperative of Real-time Battery Performance Tracking
In the rapidly evolving landscape of Commercial & Industrial (C&I) energy storage, the difference between a profitable asset and a liability is measured in milliseconds and millivolts. Real-time battery performance tracking is no longer a luxury—it is the central nervous system of any modern Battery Energy Storage System (BESS). As an industry veteran with 15 years of experience architecting grid-scale and C&I solutions, I have witnessed firsthand how granular, second-by-second telemetry transforms a static battery cabinet into a dynamic, revenue-generating grid asset.
This deep technical review dissects the architecture, metrics, and commercial implications of advanced Real-time battery performance tracking. We will explore how Tier-1 LFP (Lithium Iron Phosphate) cells, integrated with liquid-cooling thermal management and bi-directional PCS, deliver unparalleled Round-trip efficiency (RTE) and cycle life. Whether you are a System Architect, EPC, or facility manager, understanding the data streams behind the electrons is your key to maximizing LCOE and ensuring UL 9540 compliance.
Core Architecture: PCS, BMS, and the Telemetry Backbone
The Synergy of BMS and PCS in Real-time Tracking
At the heart of Real-time battery performance tracking lies the intricate dance between the Battery Management System (BMS) and the Power Conversion System (PCS). The BMS acts as the cellular guardian, monitoring individual cell voltages (typical accuracy ±1mV), temperature gradients, and State of Charge (SoC) with coulomb-counting algorithms. The PCS, on the other hand, manages the bi-directional flow of power, executing grid-forming and grid-following commands.
In a Tier-1 C&I system, real-time tracking is not just about data logging; it is about closed-loop control. The BMS communicates via CANbus or Modbus TCP to the Energy Management System (EMS), which then dispatches the PCS. Key tracked metrics include:
- Cell Voltage Delta (ΔV): The maximum difference between the highest and lowest cell voltages in a string. A ΔV exceeding 50mV triggers active balancing.
- Temperature Spread (ΔT): The variance between the hottest and coldest sensor in a module. Liquid cooling maintains ΔT < 3°C, whereas air cooling may struggle with ΔT > 8°C.
- String Current (I): Monitored at the rack level to detect shunt anomalies or ground faults.
- Insulation Resistance (Riso): Continuously measured to ensure safety per IEC 62619.
Without real-time tracking, these parameters are historical footnotes. With it, they become actionable intelligence, enabling predictive maintenance and preventing thermal runaway events before they escalate.
Liquid Cooling: The Thermal Backbone for High-Cycle Tracking
High-frequency cycling (2-4 cycles/day) generates significant heat. Liquid Cooling thermal control is the gold standard for maintaining cell temperatures within the optimal 20-30°C window. Unlike air cooling, liquid cooling plates (often aluminum micro-channel) are in direct contact with the cell modules, providing a heat transfer coefficient up to 1000x higher.
Real-time tracking here monitors coolant inlet/outlet temperatures, flow rate (L/min), and pressure differentials. If the flow rate drops below setpoint due to a pump failure, the BMS must immediately derate the PCS power to prevent localized hotspots. This level of integration is essential for maintaining a Round-trip efficiency (RTE) above 90% over the asset’s lifecycle.
Technical Specifications: Quantifying the Tracking Data
The following table outlines the critical parameters that a robust Real-time battery performance tracking system must monitor and log. These specifications are derived from Tier-1 LFP systems designed for C&I peak shaving and demand response.
| Key Parameter | Technical Specification | Real-time Tracking Metric |
|---|---|---|
| Battery Chemistry | Tier-1 LFP (Lithium Iron Phosphate) | Voltage decay rate per cycle (µV/cycle) |
| System Capacity | 215 kWh (Modular) to 5 MWh (Containerized) | Usable kWh (SoC x SoH) |
| Cycle Life | >8000 cycles @ 90% DoD, 25°C | Cumulative Ah throughput |
| Round-trip Efficiency | ≥ 92% (DC-DC), ≥ 88% (AC-AC) | Real-time AC/DC power ratio |
| Depth of Discharge (DoD) | 90% (Max Recommended) | Instantaneous DoD (%) |
| Thermal Control | Liquid Cooling (Ethylene Glycol 50%) | ΔT (Cell Max – Cell Min) < 3°C |
| Communication | CAN 2.0B / Modbus TCP / IEC 61850 | Data refresh rate: 100ms – 1s |
| Compliance | IEC 62619, UL 9540, UN38.3, CE | Log retention (SOE, Alarm history) |
These metrics are not arbitrary. They are the foundation for calculating State of Health (SoH) and predicting remaining useful life (RUL). For instance, tracking the coulombic efficiency (CE) over 100 cycles can reveal lithium plating, a precursor to capacity fade.
Commercial ROI & Grid Support: The Financial Value of Granular Data
Maximizing Peak-Shaving ROI via Precision Tracking
The commercial case for C&I BESS is built on arbitrage: charging during low tariff periods and discharging during peak demand charges. However, the ROI is dictated by how accurately the system tracks its own performance. A 2% error in SoC estimation can lead to unnecessary grid import during peak hours, eroding margins.
Real-time tracking enables Dynamic Demand Response. By monitoring the facility load curve (sampled at 1-second intervals), the EMS can forecast peak events and pre-emptively discharge the BESS. Furthermore, tracking the Round-trip efficiency (RTE) in real-time allows operators to adjust dispatch strategies based on ambient conditions. For example, if the HVAC system is consuming 5% of the battery’s output, the net RTE drops, and the EMS can decide to curtail discharge unless the peak tariff is exceptionally high.
VPP Readiness and Frequency Regulation
For Virtual Power Plant (VPP) integration, Real-time battery performance tracking is non-negotiable. Grid operators require sub-second latency for frequency regulation (Primary Reserve). The BMS must report SoC and available power (kW) to the aggregator every 100ms. Any latency in data transmission can result in penalties or disconnection. Tracking the PCS response time and ramp rate is critical for qualifying for these high-value ancillary services.
Deployment Scenarios: From Industrial Parks to EV Supercharging
Industrial Park Energy Independence
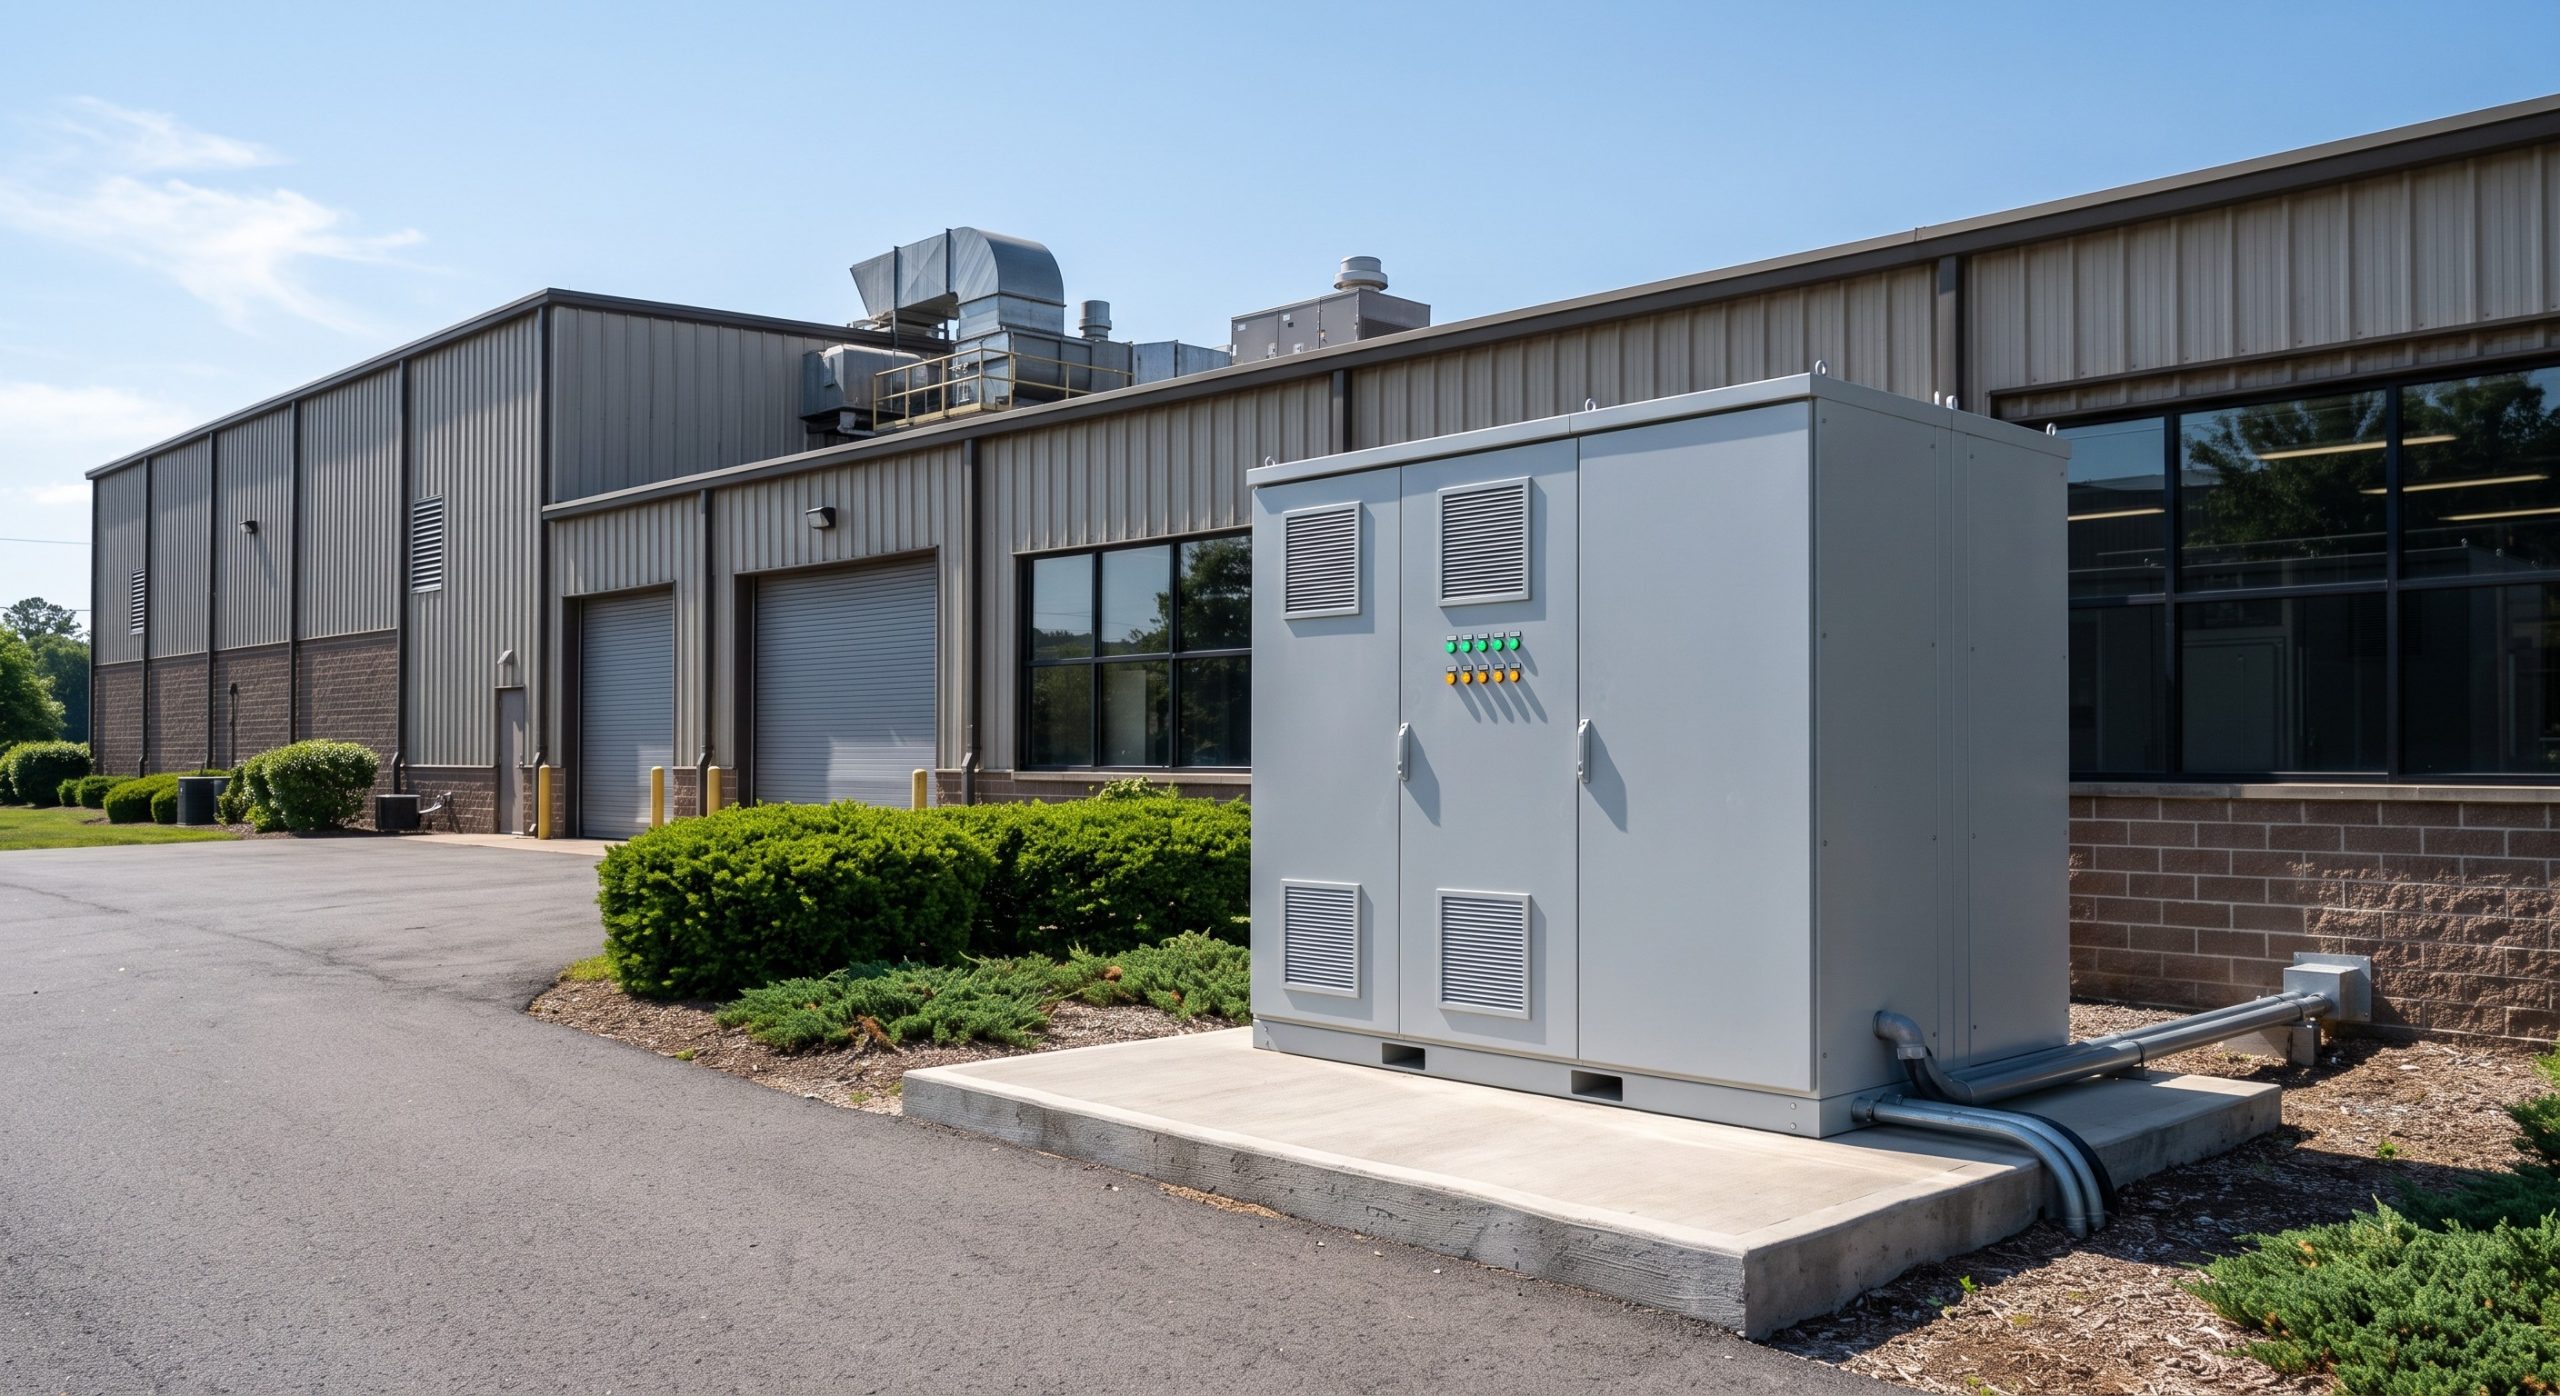
In a 1MWh modular deployment for an industrial park, real-time tracking is distributed across multiple cabinets. The central EMS aggregates data from each cabinet’s BMS to perform String-level Maximum Power Point Tracking (MPPT) equivalent for batteries—ensuring that weaker racks are not over-discharged. This prevents the ‘weakest link’ effect, extending the overall system life.
PV-Storage-Charging (光储充) Synergy
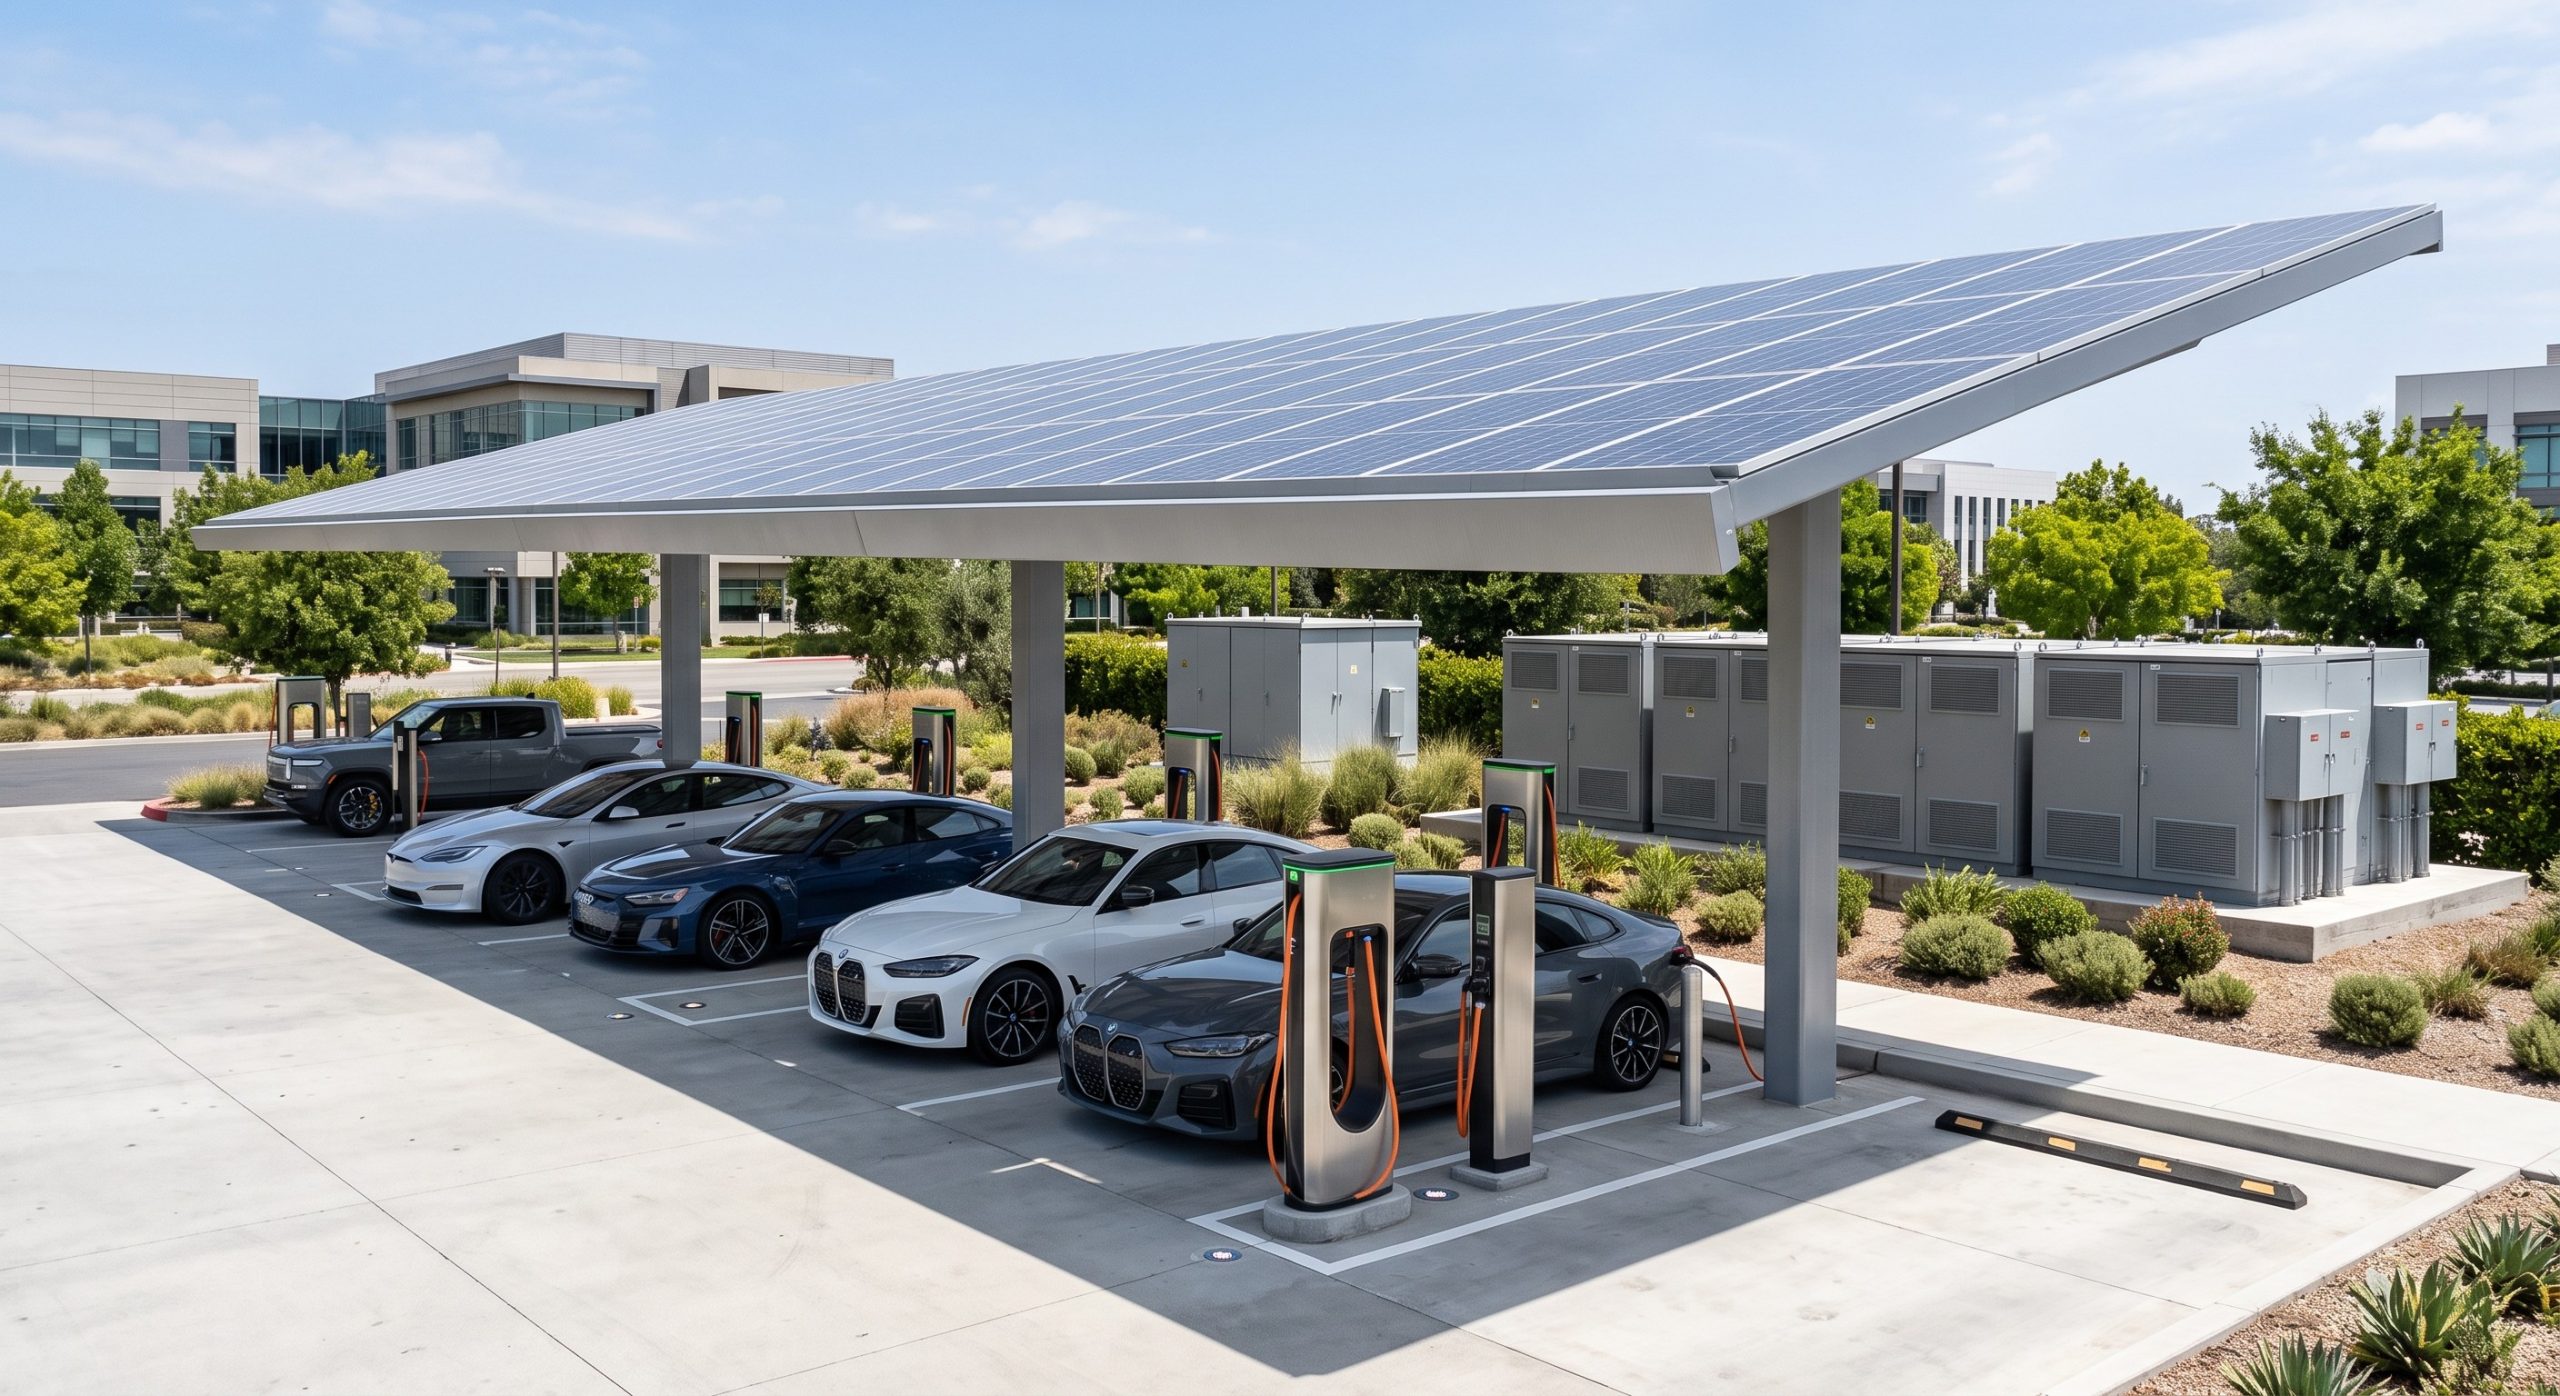
The integration of PV, storage, and EV supercharging creates a highly dynamic load profile. Real-time tracking here must be exceptionally fast to manage the fluctuating demand of 350kW+ chargers. The BMS must track the DoD (Depth of Discharge) meticulously to ensure the battery can accept regenerative braking energy from EVs without overvoltage. Liquid cooling is mandatory in this scenario to handle the high C-rates (up to 1C continuous).
Conclusion: Data as the Ultimate Asset Defender
Real-time battery performance tracking is the cornerstone of a resilient, profitable, and safe C&I energy storage strategy. It transforms a passive battery bank into an intelligent, self-optimizing grid participant. By leveraging Tier-1 LFP chemistry, advanced liquid cooling, and sub-second telemetry, asset owners can confidently navigate the complexities of demand charges, VPP markets, and decarbonization mandates.
As the industry moves towards MWh-scale deployments and stricter safety standards (UL 9540, IEC 62619, UN38.3), the granularity of your tracking data will be the single most important factor in securing insurance, financing, and long-term ROI. Do not settle for 15-minute averages. Demand millisecond precision. Your bottom line depends on it.